Compass
Business intelligence and analytics
enterprise dataview KPI logo
Compass Enterprise Pkg

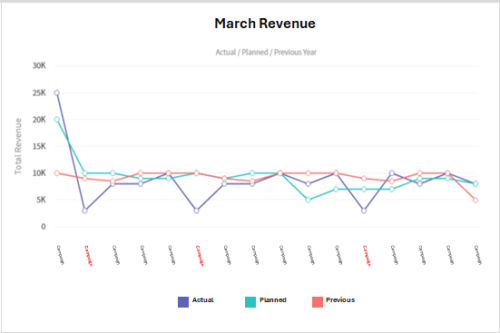
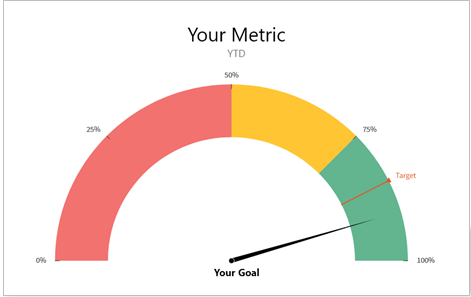
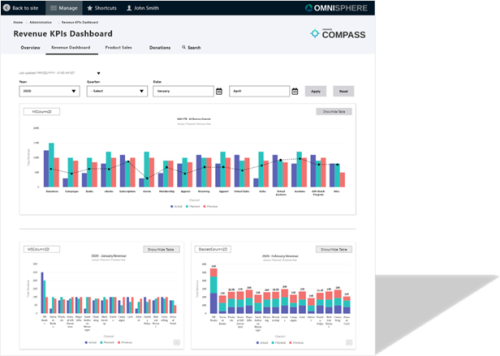
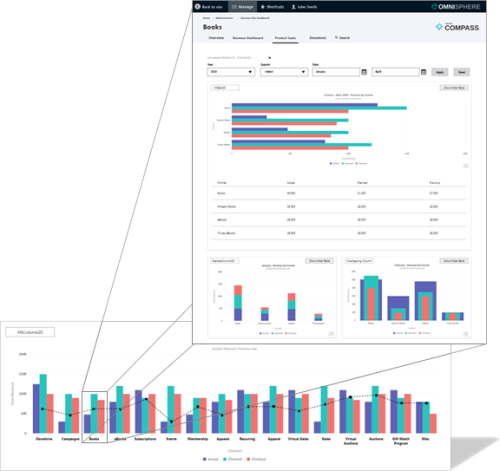
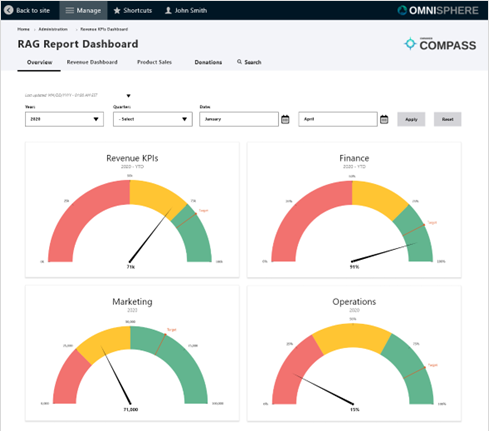
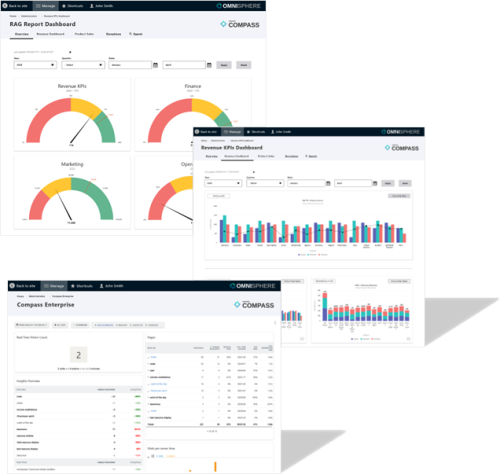
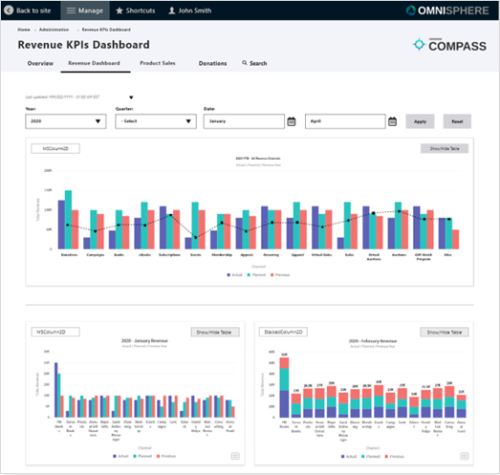
This Convene for the Cities ERP/DXP package comes complete with all the features of Allegiance and uses the data to provide business intelligence and analytics. Compass Enterprise uses that data and converts it into a tool for business and market research. It provides dashboards that are configured for your data to assess and improve the effectiveness of sales, campaigns, conversions, and overall business growth. Compass Enterprise can also be setup to utilize Google Analytics or a private server.

The Enterprise package serves as a single data silo where all your data can be funneled, measured, and analyzed. This eliminates the need to juggle multiple data sources and simplifies data management, making it easier to access and analyze.

Key Features

  • Unified data silo for reporting
  • Key Performance Indicators (KPIs)
  • Key Blessings Indicators (KBIs)
  • Dashboards configured to your business rules
  • Can plug in to multiple sales channels and present the data in unified displays.
  • The data can be broken down and drilled into in any way that fits your needs.
  • Centralized Data Repository where all your data sources converge.
  • Data Consistency and integrity, reducing the risk of errors or inconsistencies.
  • Simplified Data Retrieval: YES – REALTIME REPORTING!
  • Standardized Reporting utilizes our cyclical OmniPoint model to standardize everything we do.
decision making customization data parsing drill down metrics RAG

Benefits

  • Data Parsing and Categorization automatically parses and categorizes incoming data. This is a crucial feature as it reduces the time and effort required to prepare data for analysis.
  • Automated Data Transformation: Compass automates the process of cleaning and transforming data, reducing the manual effort required for data preparation and ensuring data is ready for analysis.
  • Data Quality Assurance: The parsing and categorization process helps identify and address data quality issues, improving the reliability of insights generated from the data.
  • Standardized Data Structures: Categorized data is structured in a standardized format, making it easier for users to work with and reducing data inconsistency.
  • Dataview™, including dashboards, offer an intuitive and visually appealing way to monitor and analyze your data.
  • Visual Storytelling, Interactive Dashboards
  • Exportable, Goal-Based Reporting provides RAG reports, (Red, Amber, Green) charts, based on goals to give a high-level overview of your data's performance.
  • Strategic Alignment, Early Issue Identification, Performance Tracking
  • Drill-Down Capabilities for a more detailed analysis. This is essential for identifying the root causes of performance issues or discovering opportunities for improvement.
  • Comparative Analysis include three key metrics: actual, planned, and previous. This comparative analysis helps organizations evaluate current performance in relation to their goals and historical data.
  • Actual, planned, and previous metrics provide context for evaluating current performance.
  • Historical data comparison enables trend analysis, helping to identify whether they are progressing or regressing over time.
  • Key Indicator Tracking tracks the most important indicators for success and adjust strategies accordingly.
  • Customization of dashboards and visualizations can be tailored to suit the specific needs of your business. You can define your own key performance indicators (KPIs), key blessing indicators (KBIs), reports, and dashboards, ensuring that the tool aligns with your unique business objectives.
  • User-Friendly Interface that makes them powerful to a wide range of users, even those without extensive technical or data analysis backgrounds.
  • Accessibility, Training Efficiency, Self-Service Analysis, Reporting Made Easy